Why Does Everyone Speed on Orchard Drive in Twin Falls, Idaho?
I'm writing this story because I'm also guilty of it.
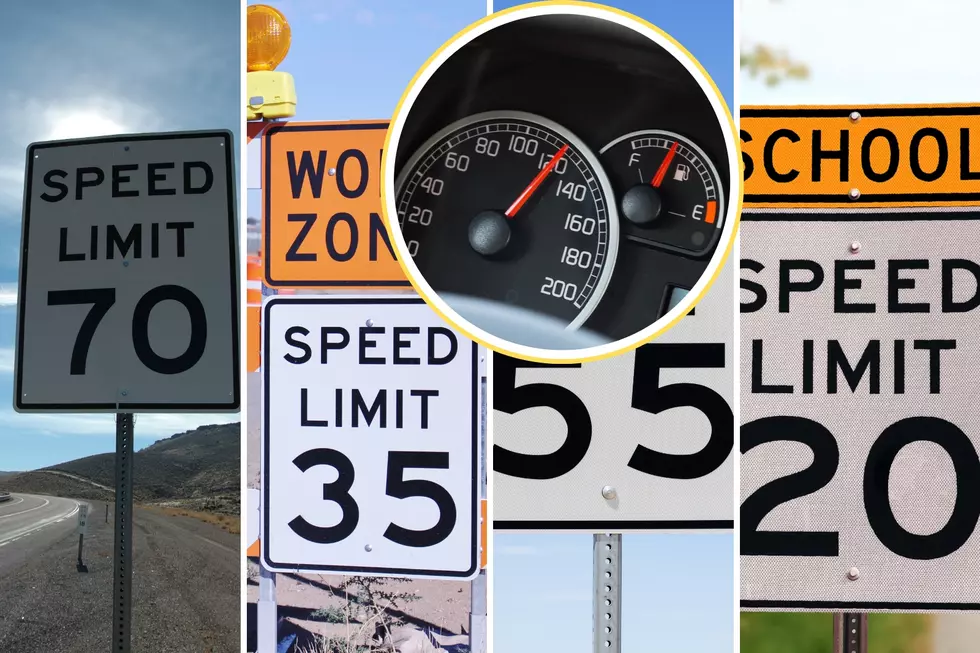
I've been noticing this a lot lately, since I drive along Orchard (3700 N) a few times every week, that the speed limit seems to be like a pirates code: more a set of guidelines than rules. This is interesting since the speed limit is constant now rather than the fluctuating speed it used to be, you think we could do better at maintaining our acceleration control.
What Is The Speed Limit On Orchard Street South Of Twin Falls?
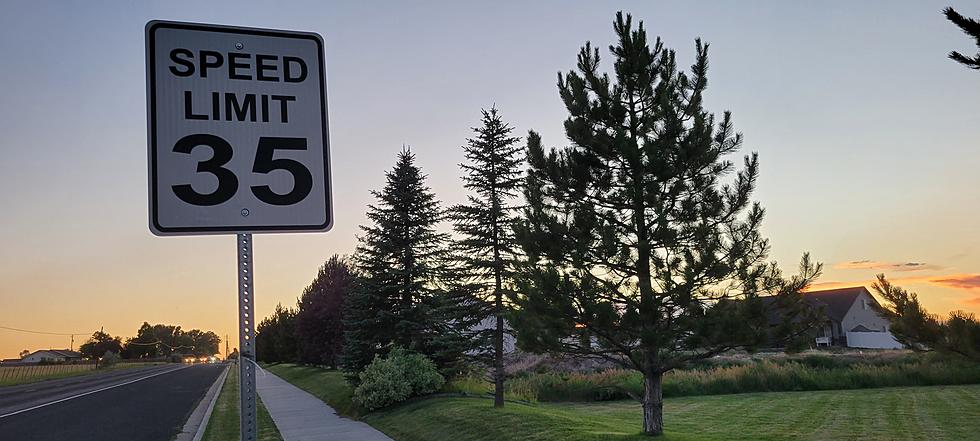
The current speed limit on most of Orchard is 35 MPH. It used to fluctuate between 35 and 50 depending on where you were driving. In December the speed limit between Eastland and Blue Lakes was lowered from 50 to 35 and a few years ago the section between Harrison and Blue Lakes was also lowered to 35. That makes the entire stretch of road between Washington and Eastland 35 MPH now.
I still catch myself going over 35 sometimes after the red lights at the Blue Lakes intersection. It still feels to me like that section should be faster, so I go faster out of habit. I'm not the only one. I often have someone riding my bumper along the road as I try to maintain the right speed (or close to it).

Why Do So Many People Speed Along Orchard?
It seems like many people speed out of habit, like me, but other do it for a different reason: because they can. I won't say there are never cops on the road pulling people over, but I've never seen a patrol car on Orchard unless it was already in route to somewhere with its lights on. Some people don't feel the need to obey speed limits if there is nobody there to enforce it.
LOOK: Route 66’s quirkiest and most wonderful attractions state by state
Gallery Credit: Kery Wiginton
LOOK: See how much gasoline cost the year you started driving
Gallery Credit: Sophia Crisafulli
More From Kool 96.5